

Insights
Navigating Your Way Round the New GA4 Interface.
July 14, 2023

Written by:
The new Google Analytics 4 (GA4) interface might seem a little bare if you are used to Universal Analytics, but with some guidance, you’ll soon be able to navigate it like a pro. Here, we break down the essentials of navigating the new GA4 interface.
The GA4 Home Page
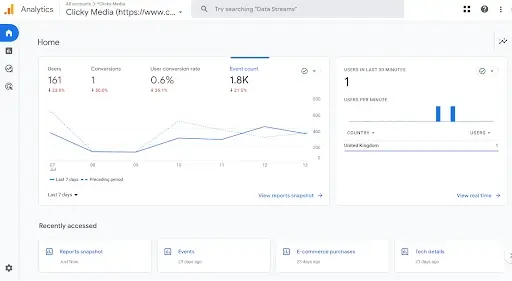
Upon logging into GA4, the home page is the first thing you’ll see. This streamlined interface offers a quick overview of your key metrics, real-time data and trend analysis.
Left Hand Navigation Menu
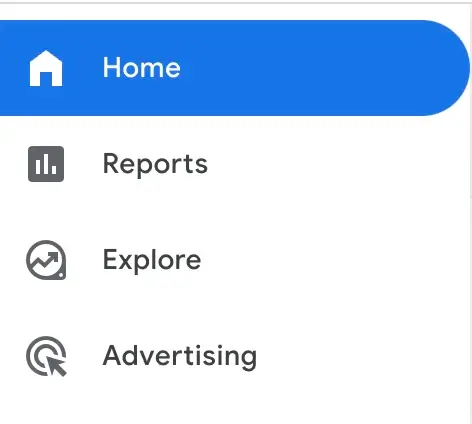
This is your control hub, from where you can access most of the GA4’s features:
Reports
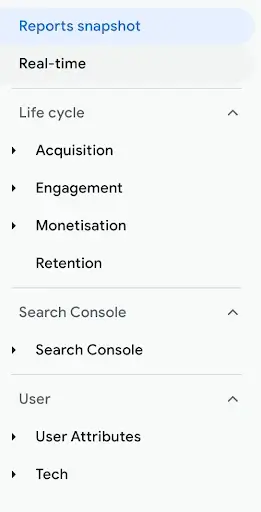
The reports tab is where you will spend most of your time, at least at first. It contains several pre-defined reports for identifying how users are navigating and interacting with your site.
-
Realtime: This report gives you an immediate snapshot of what is happening on your website. This includes the number of users currently on your site, their geographical locations, the pages they are browsing and the source of their visit.
-
Life Cycle: Here you’ll find all the standard GA reports like Acquisition, Engagement, Monetisation and Retention. It’s designed to reflect the customer journey, offering insights into how users find and interact with your site – Acquisition, includes tracking the sources that drive traffic to your website or app, such as organic search, paid advertising, social media, or referrals. Engagement; measures how users interact with your digital property. It includes metrics like session duration, pageviews, screen views, events, and conversions. By analysing engagement data, you can determine which content or features are most popular, identify areas for improvement, and optimise the user experience. Monetisation; In this stage, you track the revenue generation and monetary value of user interactions. This includes e-commerce transactions, subscription sign-ups, in-app purchases, or any other actions that contribute to your business’s financial goals. Retention focuses on measuring user loyalty and the likelihood of users returning to your digital property. It involves analysing metrics like user retention rate.
-
User: This section offers deep dives into demographics, interests and devices of your audience.
Explore
The exploration hub is where you can create custom reports. You can use templates provided by GA4 or start from scratch. With a drag and drop interface, you can dissect your data in multiple ways, tailoring your reports to your exact needs. Once you are comfortable working in GA4, this is where you will create more advanced reports to meet the individual needs of your team/website.
Advertise
The advertising section in GA4 focuses on tracking and measuring the effectiveness of advertising campaigns. It uses an event-based model to capture user interactions and conversions, allowing you to track events like ad clicks and video views. You can measure campaign performance across different channels, analyse the user journey, and optimise targeting. GA4 offers cross-device and cross-platform tracking, integrates with Google Ads, and provides audience insights for better targeting. Overall, it helps marketers analyse and optimise their advertising efforts for improved results.
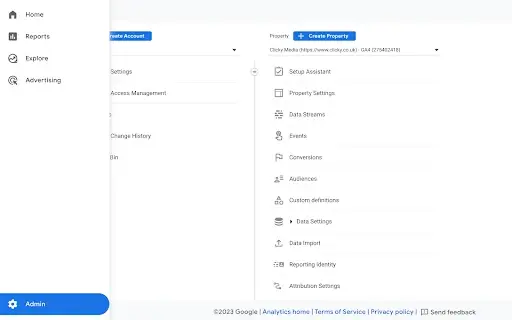
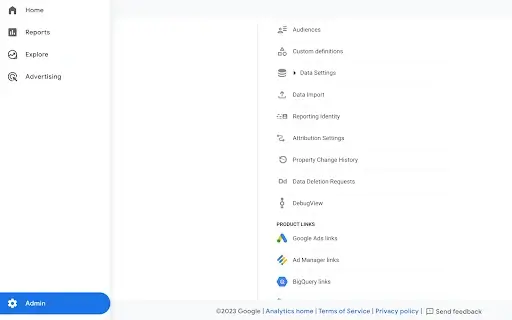
Admin
This section is where you can manage your data streams, events, variables, audiences and more. It is here where you set up new properties, manage users or import data.
Event Tracking and Conversions
GA4 has a more sophisticated approach to event tracking and conversions compared to UA. Not only can you see how users interact with your content, but you can also easily mark any event as a conversion by setting up conversion tracking. To do this, you need to set it up in the admin section, click on “Events” under the “Property” section.

Click on the “+ Create event” button to create a new event definition. Provide a name for your event that represents your conversion event. For example, if your conversion event is “Purchase,” you can name it as such. Save the event, once your event definition is saved, you can start using it in your tracking code or through the Google Tag Manager (GTM). Implement the event code snippet on the page or in the GTM container where the conversion event occurs. Customise the event code snippet to match the event parameters you defined in the event definition. For example, if your event definition includes an event parameter for the purchase value, you need to pass that value when triggering the event. After the event is triggered and recorded, you can track and monitor conversions in the GA4 interface under the “Events” report or any custom reports you create.
Audiences
Creating audiences in GA4 allows you to group users with common attributes. This is beneficial for remarketing, personalising experiences, or tracking specific user behaviours. To do this, click on “Audiences” in the admin section then “+ New Audience”.
Provide a name for your audience and define the criteria that will identify your audience. Specify the membership duration, which determines how long a user must meet the criteria to be included. View the estimated audience size to get an idea of the potential reach. Preview the audience to see a sample of users who meet the criteria. Once satisfied, click “Create Audience” to save it. The audience will start populating with users who meet the specified criteria. You can now use the audience for analysis, reporting, or remarketing purposes within GA4.
Debug View
DebugView is a useful tool within GA4 that allows you to see data as it arrives. It’s a great tool for troubleshooting, allowing you to verify if your events are set up correctly.
To conclude, navigating the new GA4 interface may initially feel unfamiliar, but with the right approach, you can uncover invaluable insights to optimise your digital property’s performance. By understanding the navigation structure, leveraging the Overview report, harnessing the power of the Analytics Hub and configuring your settings effectively, you’ll be well on your way to mastering GA4. Embrace this enhanced analytics tool to make data driven decisions and drive your business to new heights of success.